 .pdf
.pdf
Getting Started
Welcome to Ktirio-GUI! This guide will help you create your first project, configure essential servers, and visualize geographical and building data. Follow the steps below to get started with Ktirio-GUI.
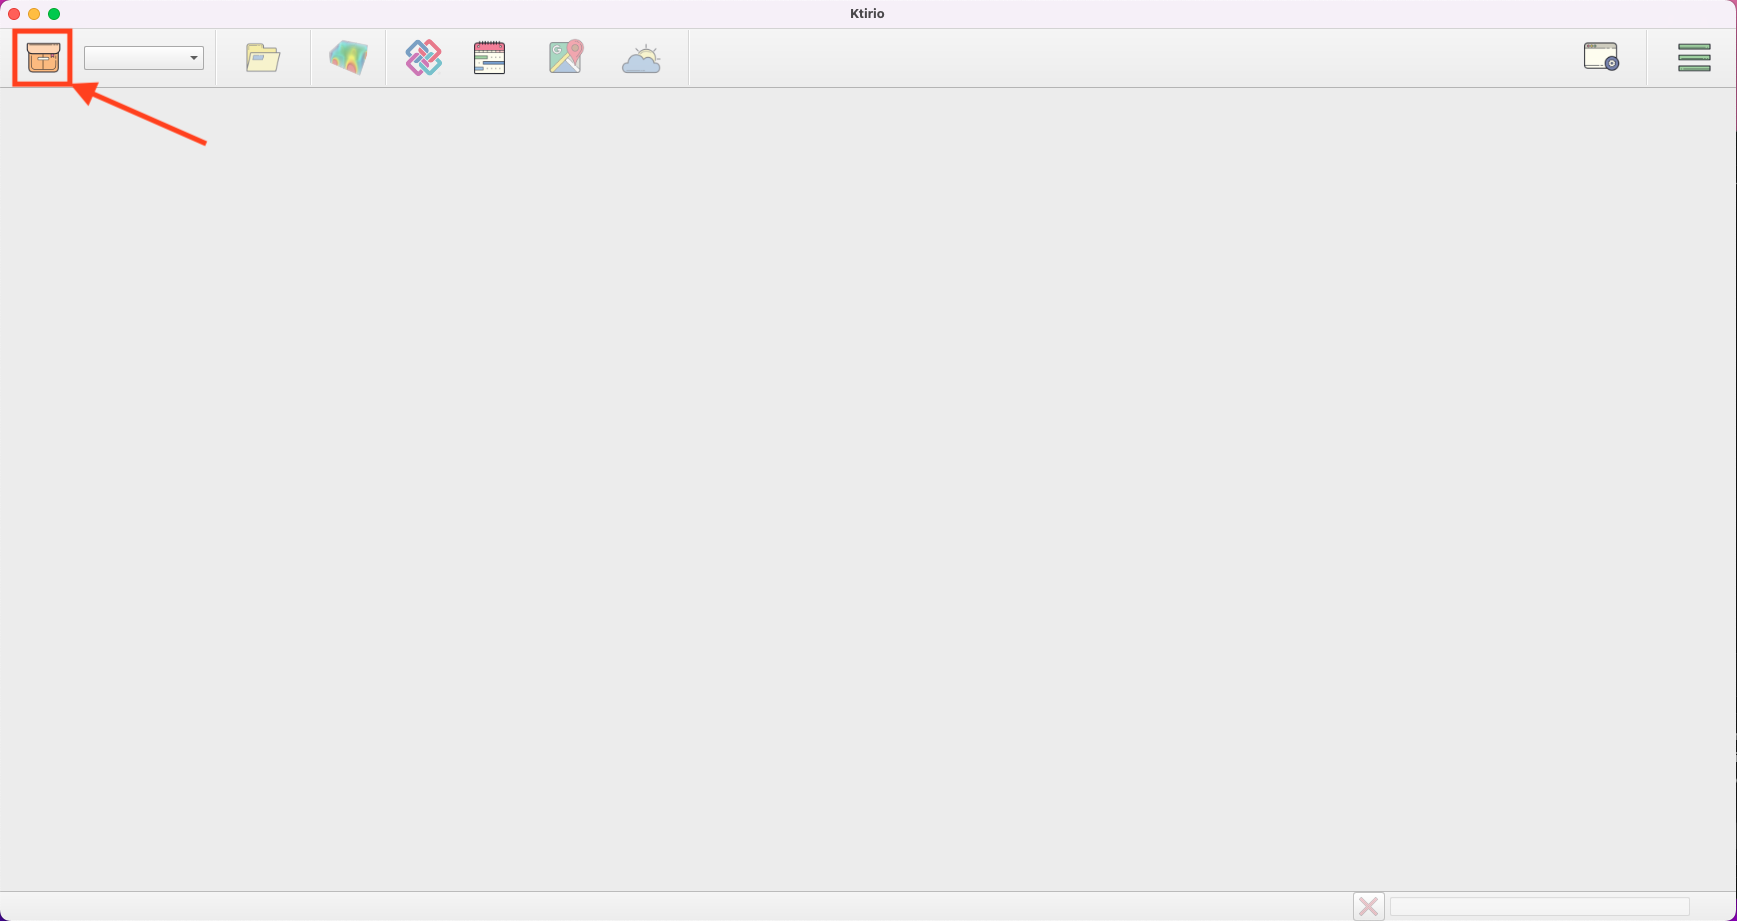
While launching the Ktirio-GUI, the first screen includes a toolbar at the top. The first step is to create a project.
Click Create project in the toolbar.
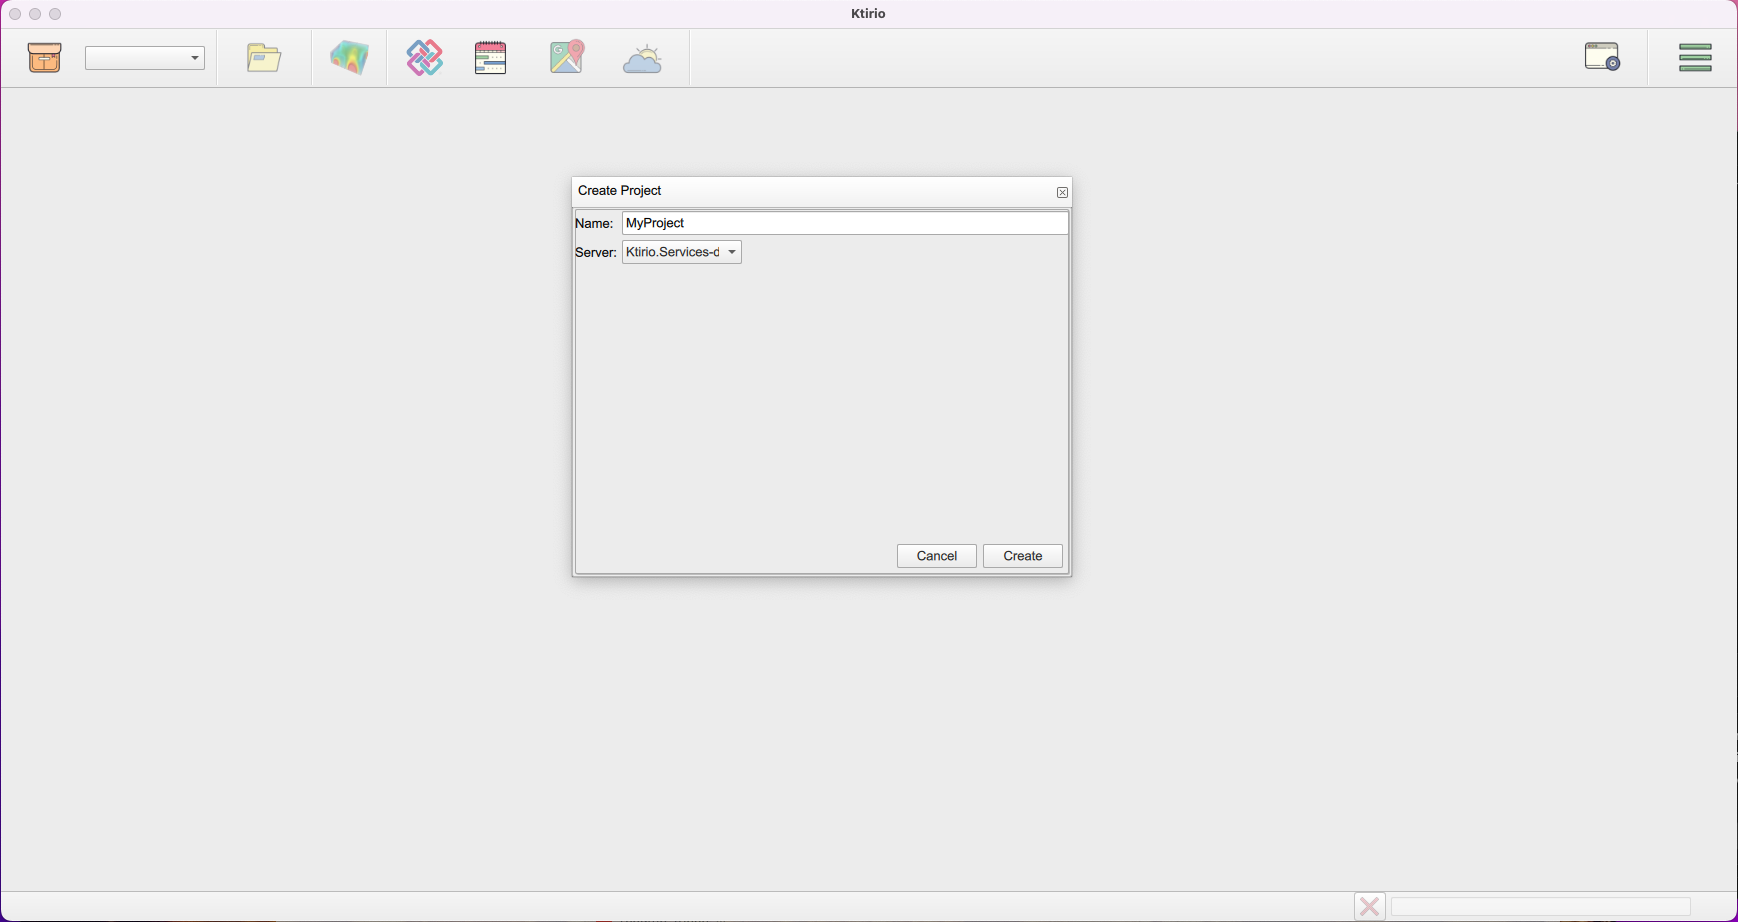
A box with the project information appears. Enter the project Name, then click Create.
1. Servers configuration
To use correctly the Ktirio-Gui application, you have to set up several servers:
-
MapBox server for geographical data: you have to create an account and a token here.
-
OpenMeteo for weather data: the web site for historical weather data and API here.
-
Girder for data storage (optional): a shared and online data storage platform here.
-
Ktirio Services for simulations: Ktirio services for building energy modelling and simulation here.
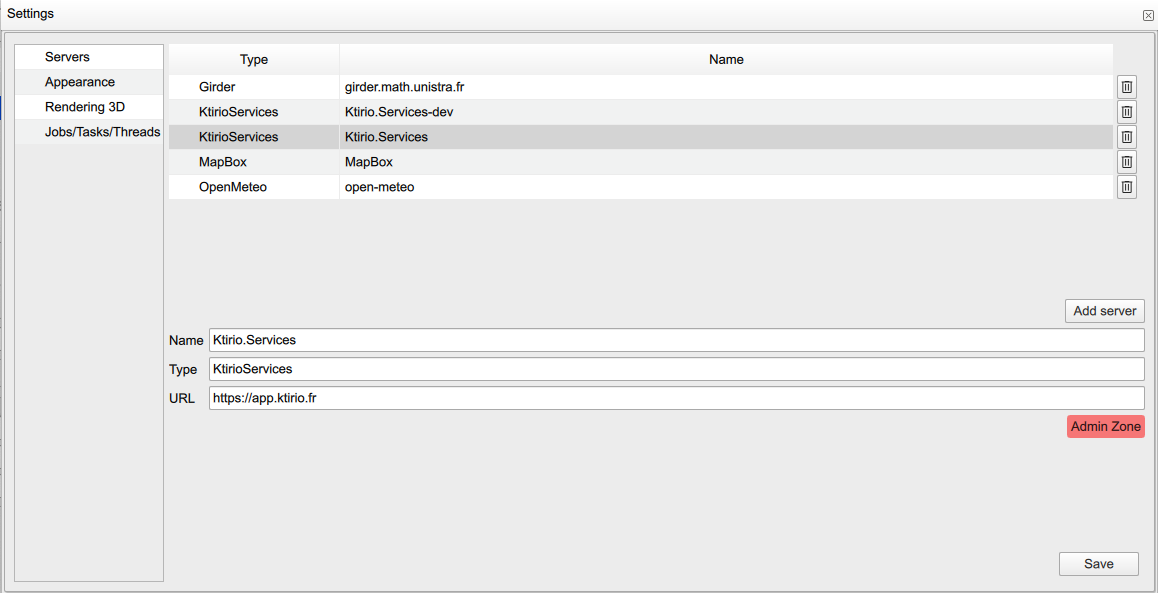
To configure a server, you have to:
-
Open .
-
In Settings, select Servers, then click Add server.
-
Fill in the server properties: Name, Type, and URL.
-
Click Save.
2. Setting a location or area of your interest
2.1. Setting a location or an address
Once the Mapbox server configuration is set, you can use OpenStreetMap data to locate and visualize your building of interest on a geographical map.
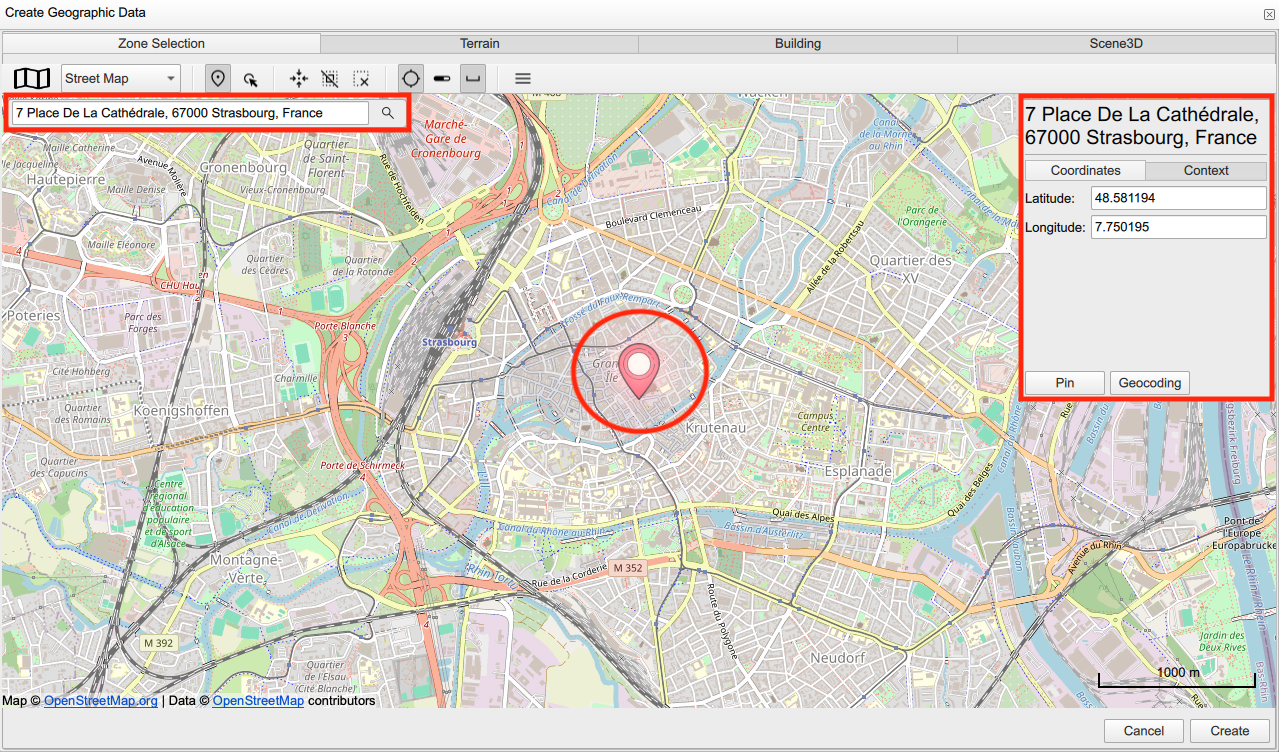
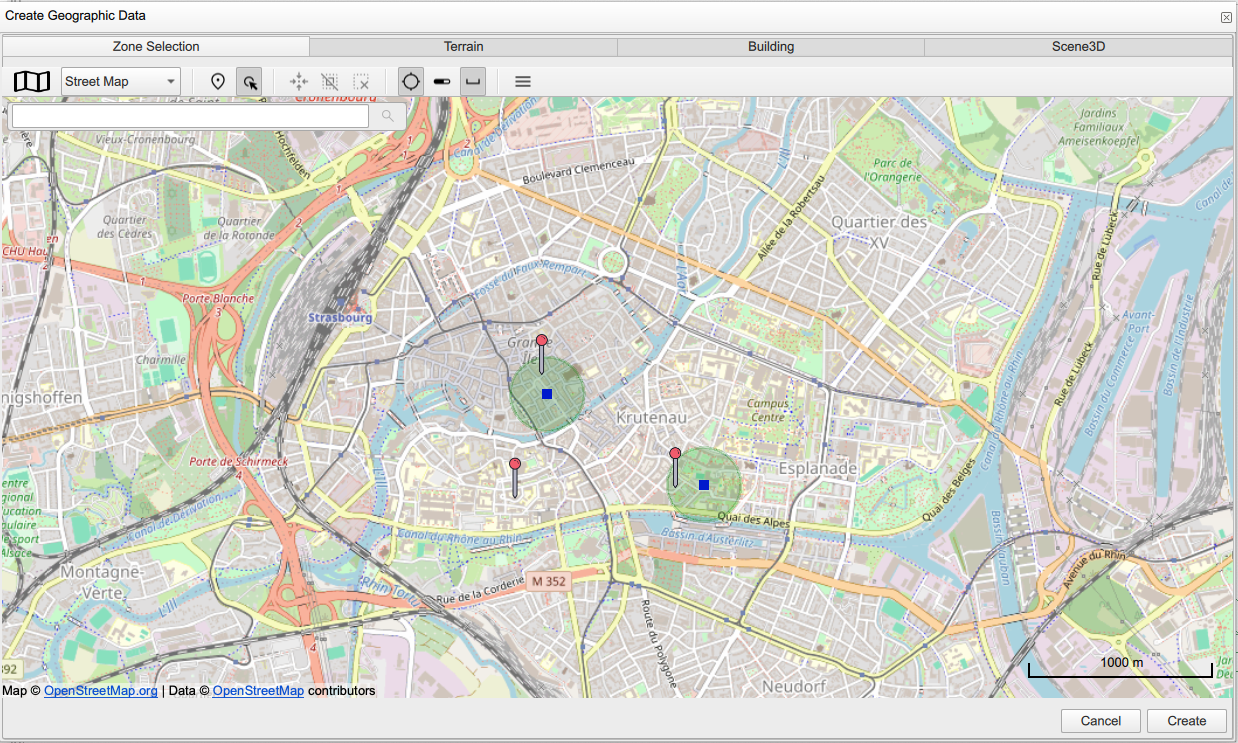
To do so, click Create geographical data. A window is displayed with four panels: Zone selection, Terrain, Building, and Scene 3D.
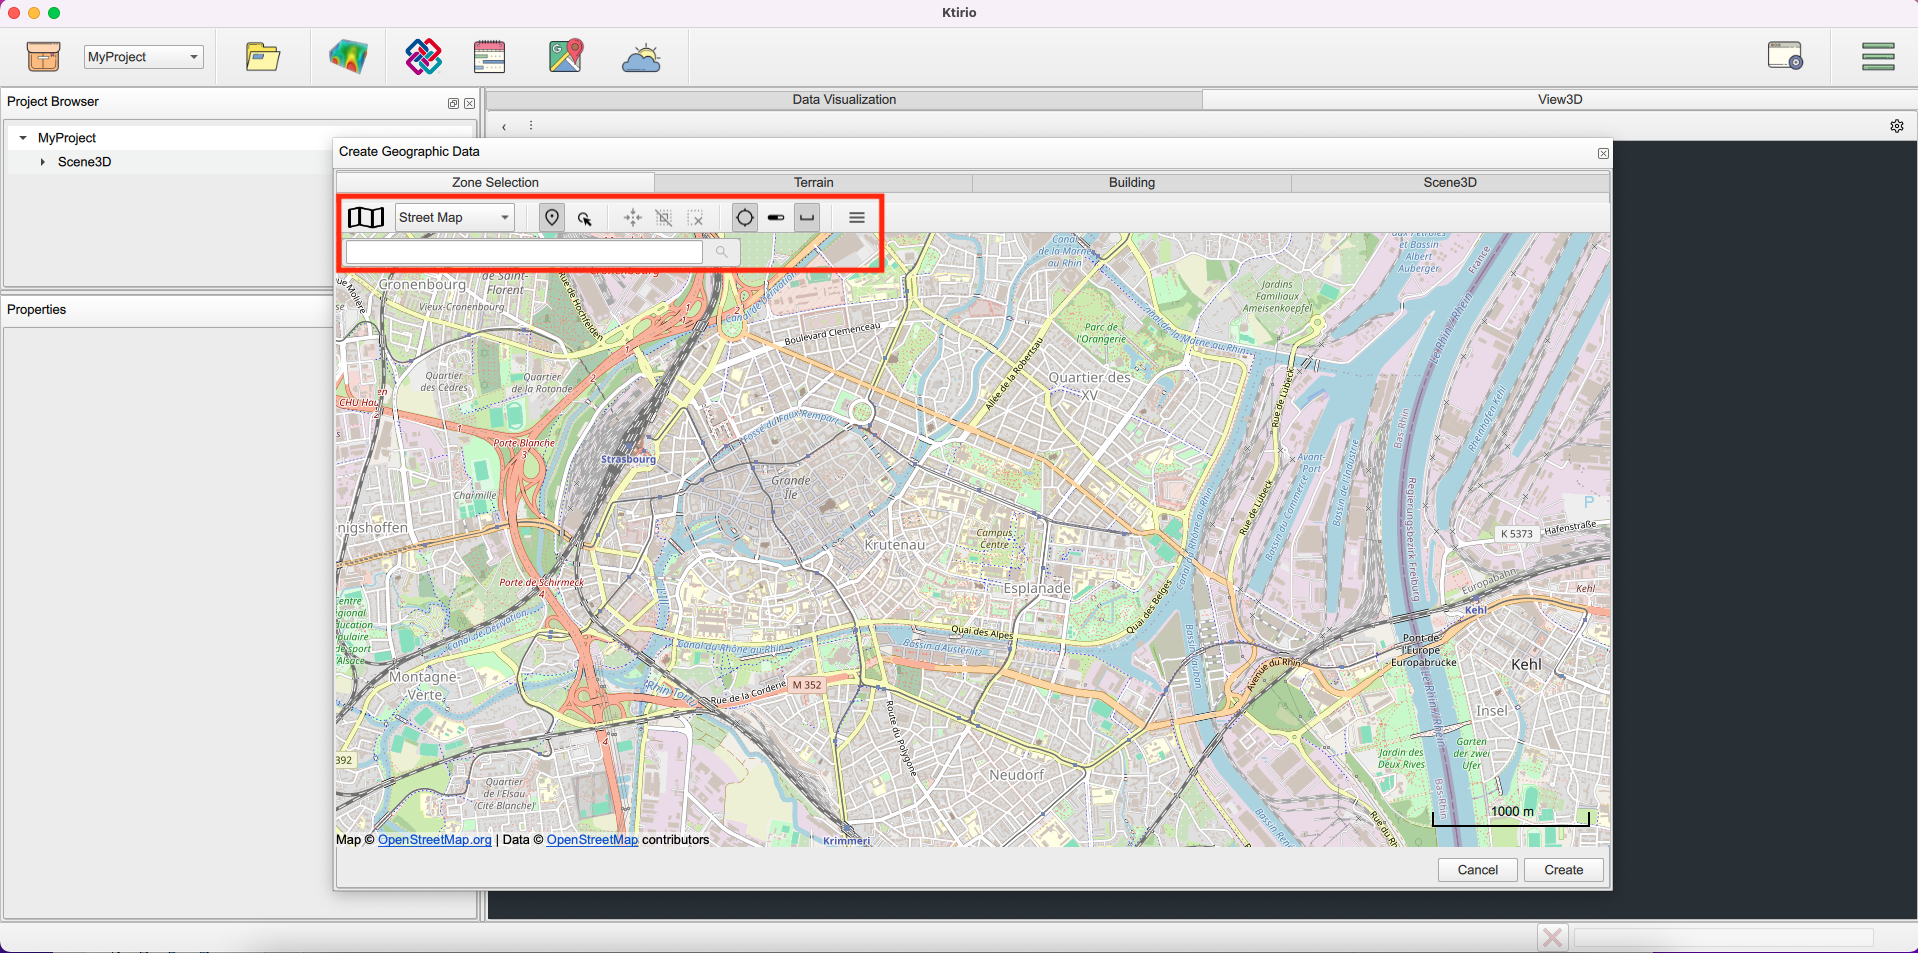
In the "Zone selection" window, you can set up your location of interest using two methods:
the address of your interest, for example: 7 Pl. de la Cathedrale, 67000 Strasbourg, France. You will see a geographical curser pointing to the selected address and a window with the address and the corresponding geographical coordinates and the context information (address, place, neighborhood, region and country).
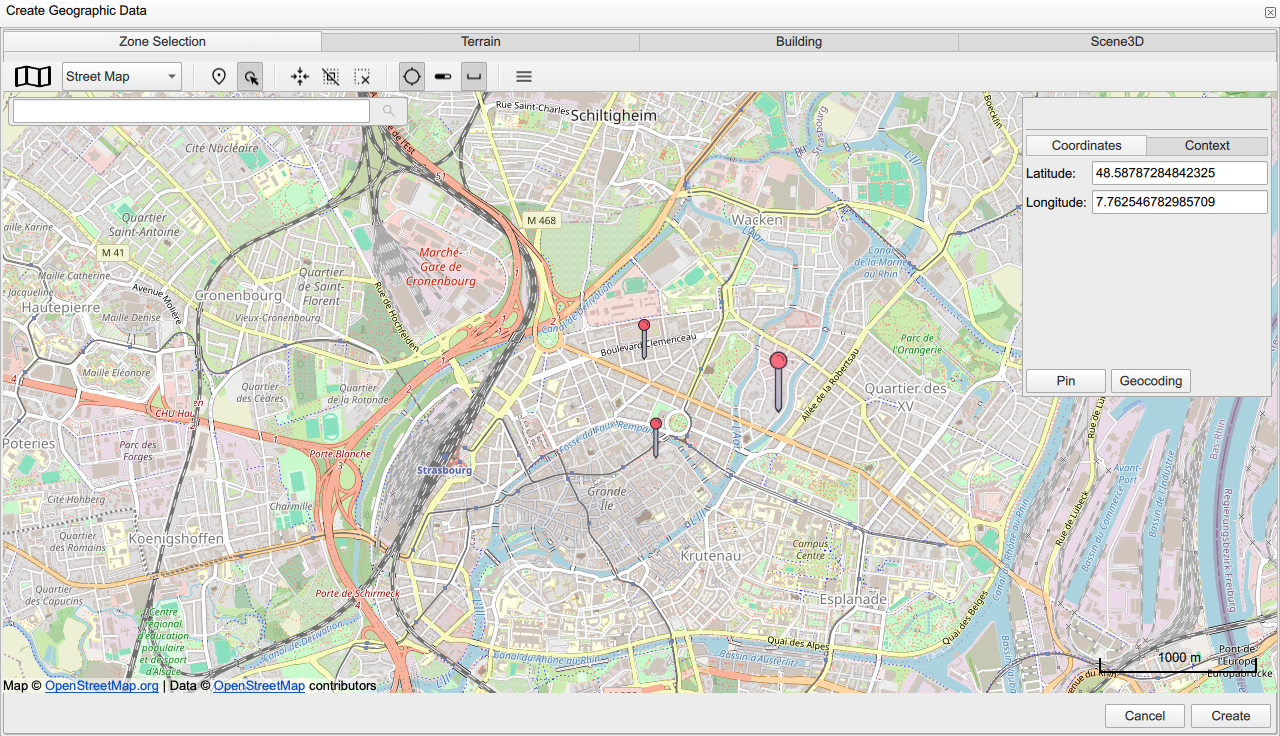
The geographical coordinates (latitude and longitude) of your location of interest. Use Location mode, then add the location pointer.
You can retrieve the address, coordinates and context information using Geocoding in the top-right panel.
You can select several locations using Ping after each selection.
Other useful tools are available in the toolbar, which help handling the map of your location of interest.
-
Selection mode: allows selection of a pinged location.
-
Centre on selection: centers the geographical map view on the selected location.
-
Deselect: deselects a selected location.
-
Remove current selection: removes a selected location.
-
Show/hide panel search location: shows or hides the address field panel.
-
Show/hide map scale: shows or hides the map scale.
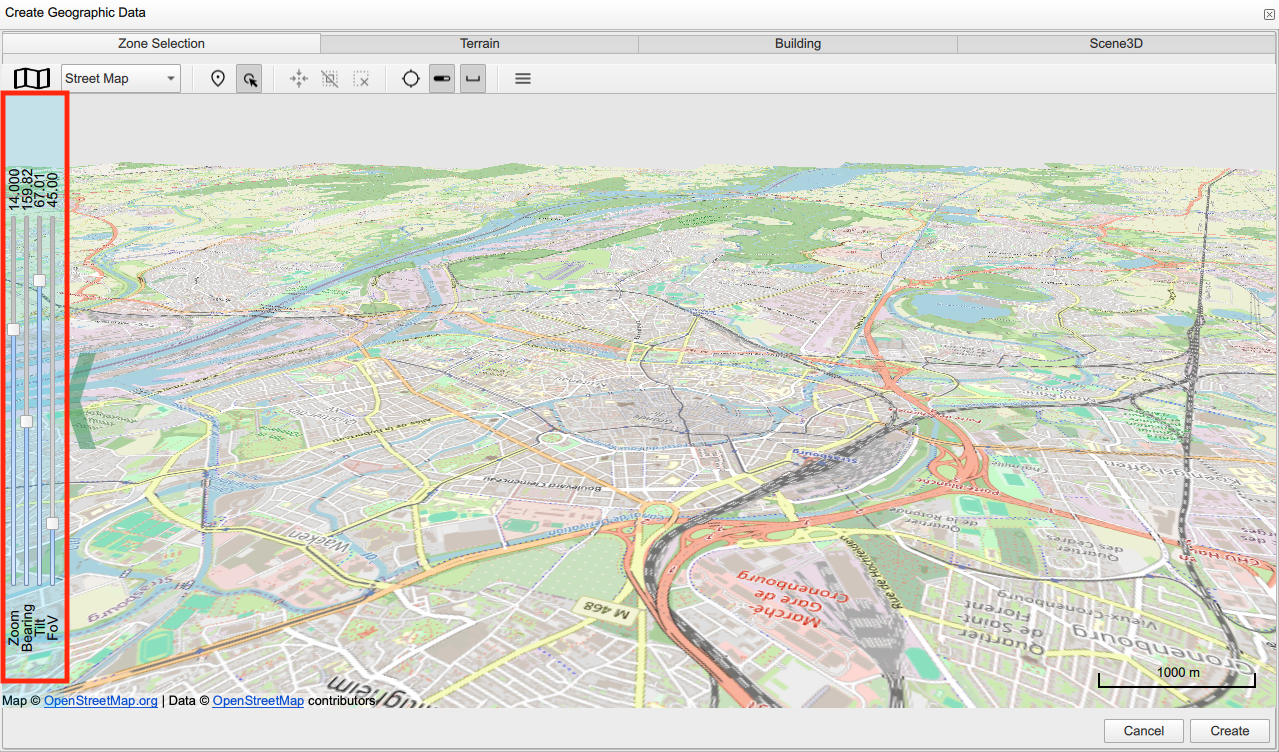
-
Show/hide panel camera setting: shows or hides camera settings to adjust the 3D view using Zoom, Bearing, Tilt and FoV.
2.2. Setting an area of interest
To identify an area of interest, you can use the "Add zone selection"  tool. When clicking the widget, you can select "Add zone selection". Then you can create a zone by selecting the zone center in the map, then "Next", then set in the radius of your zone, then "Accept". You can create different zones in your project by selecting the center and the radius each time.
You can use the previous tools mentioned above to  select and area,
  center the map on a selected area,
  deselect and area,
  remove a selected area,
  show/hide the scale on the map of your area,
  use the camera view to adjust the map of your area.
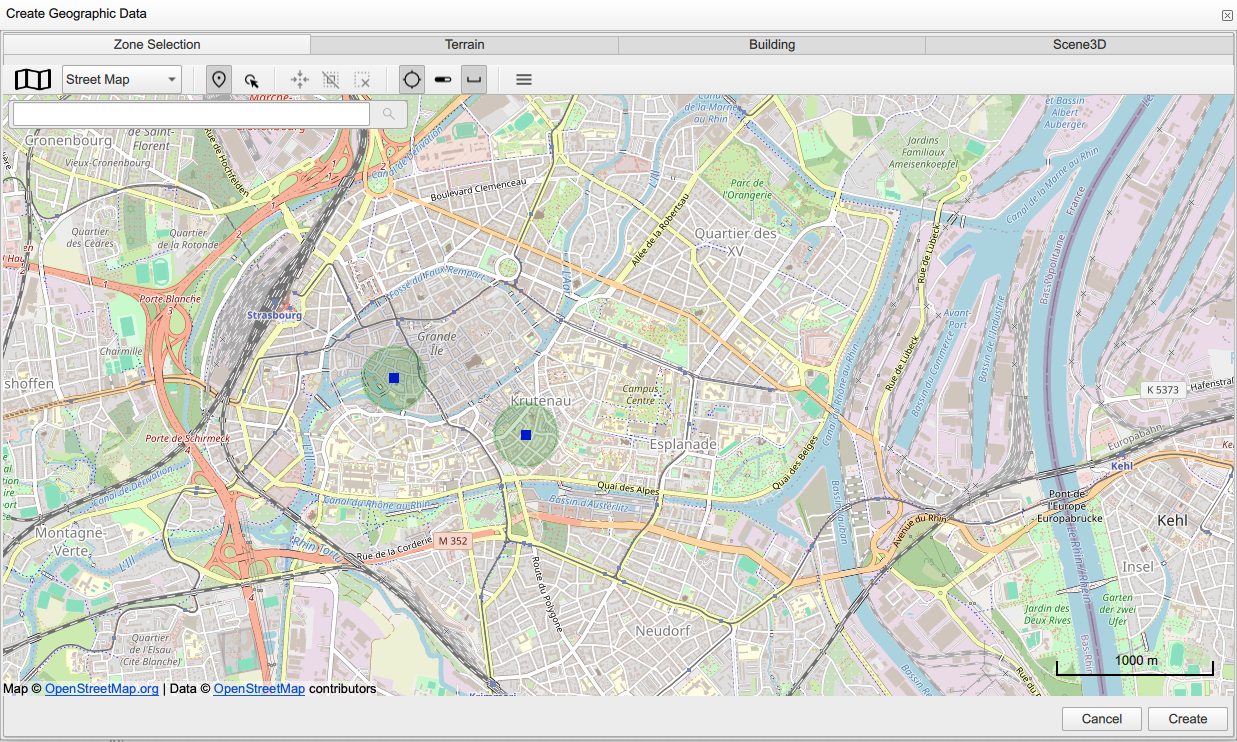
You can have combined zones and buildings in your project or ping a building of your interest within its neighborhood (or several buildings within several zones).
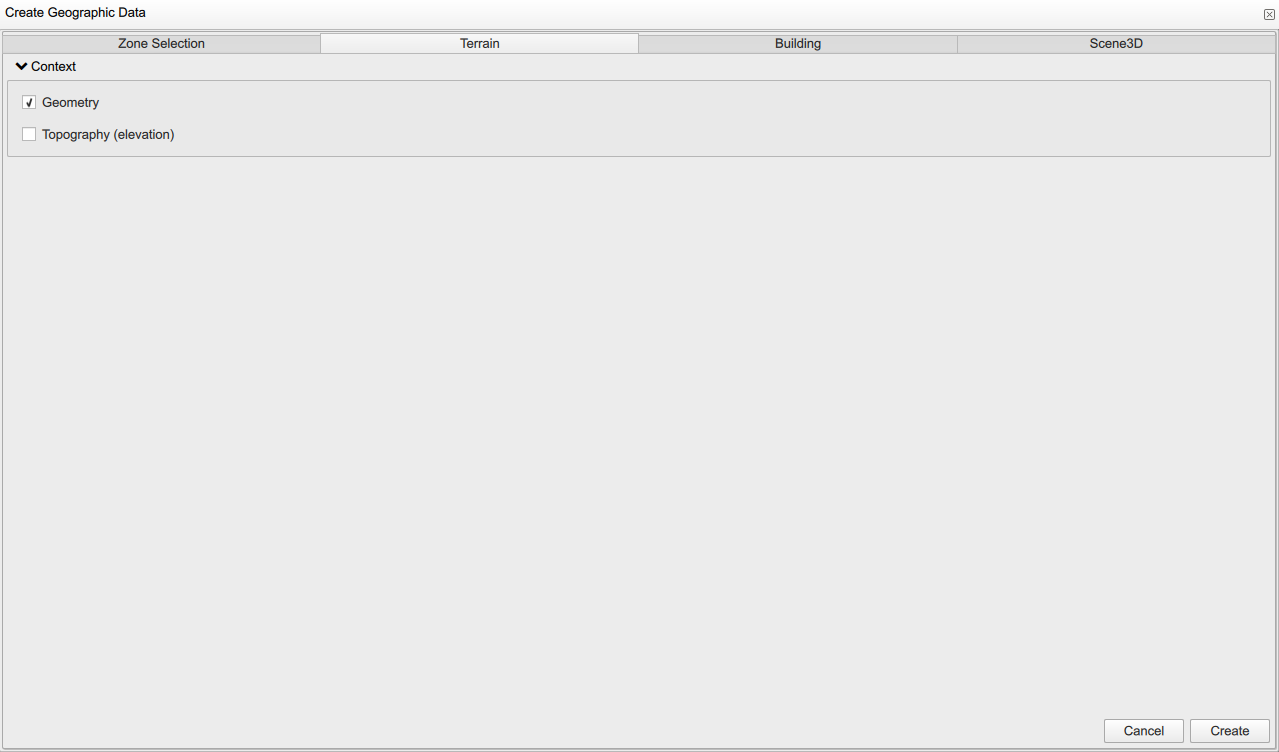
2.3. Setting terrain information
The second window of the information bar is the "Terrain". Here, you are creating a mesh, so you have to check the field "Geometry" to create a 2D map. Then you can able/enable using the terrain elevation by checking "Topography". The latter field can be important in the case of mountainous area/location where the elevation variation is significant.
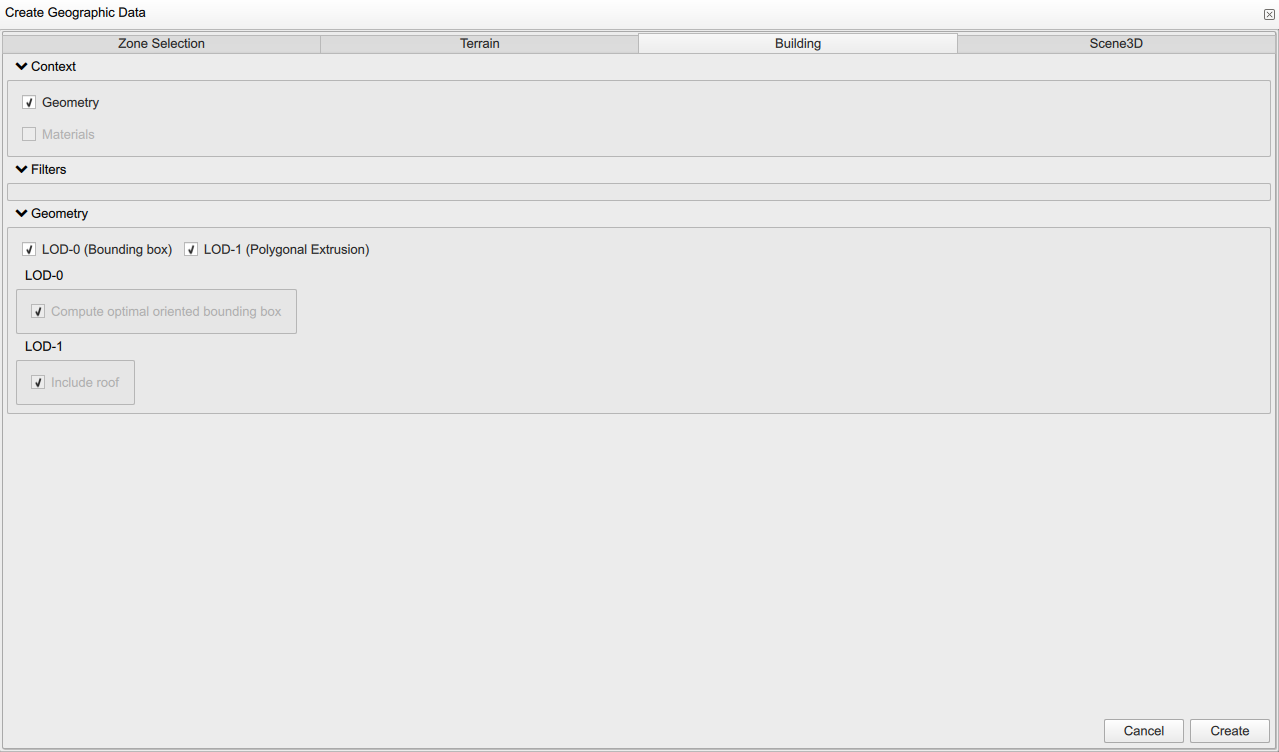
2.4. Setting buildings level of details
The third window is set to be "Building". Here you can set up fields of building of your interest. "Context" information blocks corresponds to what building data you are interested in, such as "Geometry", building "Materials".
Also, you can set the level of details of your buildings in the "Geometry" block. You can choose the "LOD0" if you are interested in coarse building modeling using building bounding box or "LOD1" for more detailed building geometry using polygonal extrusion.
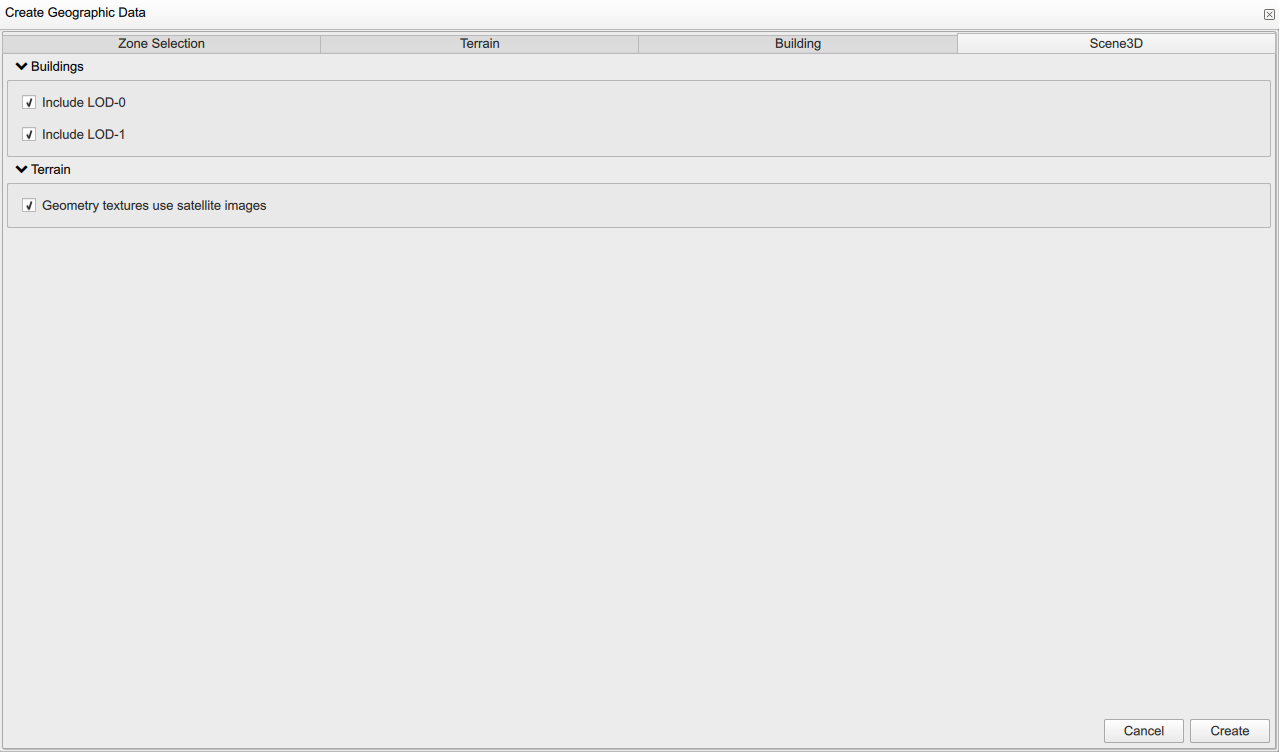
2.5. Setting project’s level of details and background
The last window is "Scene 3D". Here you can configure the building visualization in your 3D map to include "LOD0" using the building bounding box and "LOD1" with more detailed 3D geometry.
Also, you can able/enable the use of "Satellite images" as a background of your geographical map. When enabled, it brings more visual information, such as road network, vegetation, green areas, rivers and seas.
When all information fields are filled, you can click Create.
2.6. Basics of city visualization
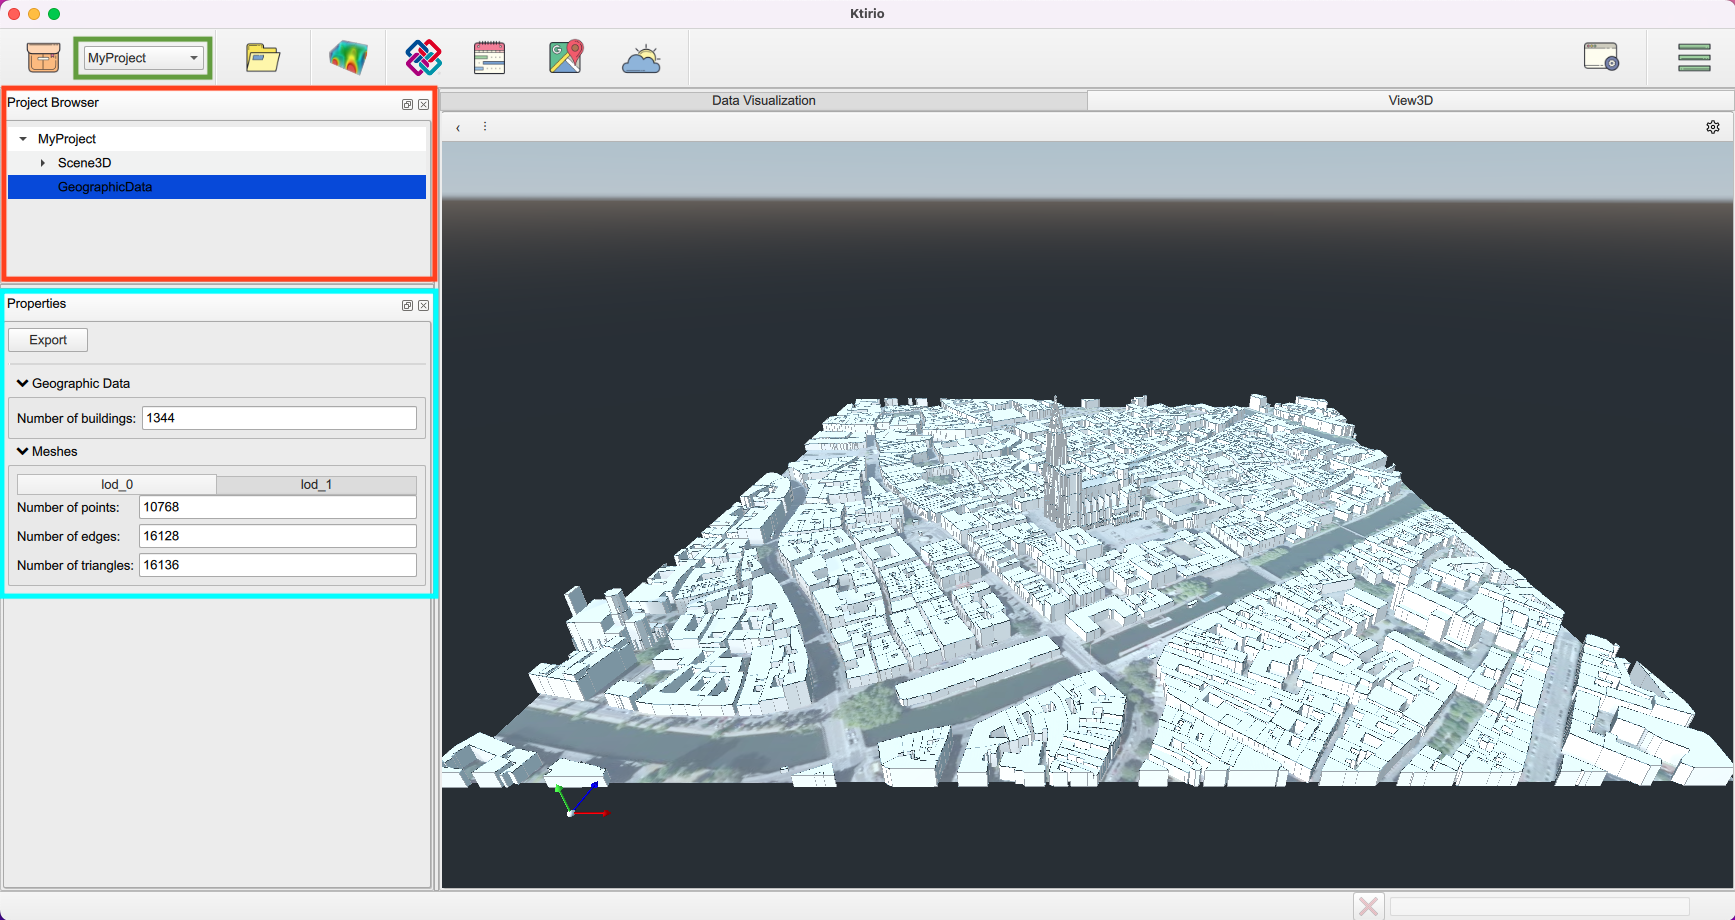
Congratulations, you have created your geographical 3D map. You can adjust it to get the best viewing point for you. Also, you can create several projects, and navigate through them using the navigation bar (bar highlighted in green in the next screenshot).
we are interested in two panels:
- The "Project browser" panel (highlighted in red color)
-
allows the visualization of your 3D scene components, here the geographical data. You can navigate along the different data layers to visualize/hide layers at your convenience.
- The "Properties" panel (highlighted in cyan color)
-
enables the visualization of properties of the area in the 3D scene, such as number of buildings and meshes features. It allows as well to export the geographical data. To do so, you can click Export.
A "Geographical Data Exporter" box enables you to choose what data to export ("GIS" data, "Mesh LOD0" data and "Mesh LOD1" data). Next you can choose the path directory to save your data files. Each dataset is written in a separate file in a specific format. GIS data are set in a .json file type. Mesh data are set in a .msh file type.
2.7. Loading building samples
Ktirio-Gui has several building samples test cases. The latter buildings had a well known detailed geometry with known construction materials. Some are equipped with indoor comfort sensors. The data recorded by these sensors enable the validation of energy and comfort models.
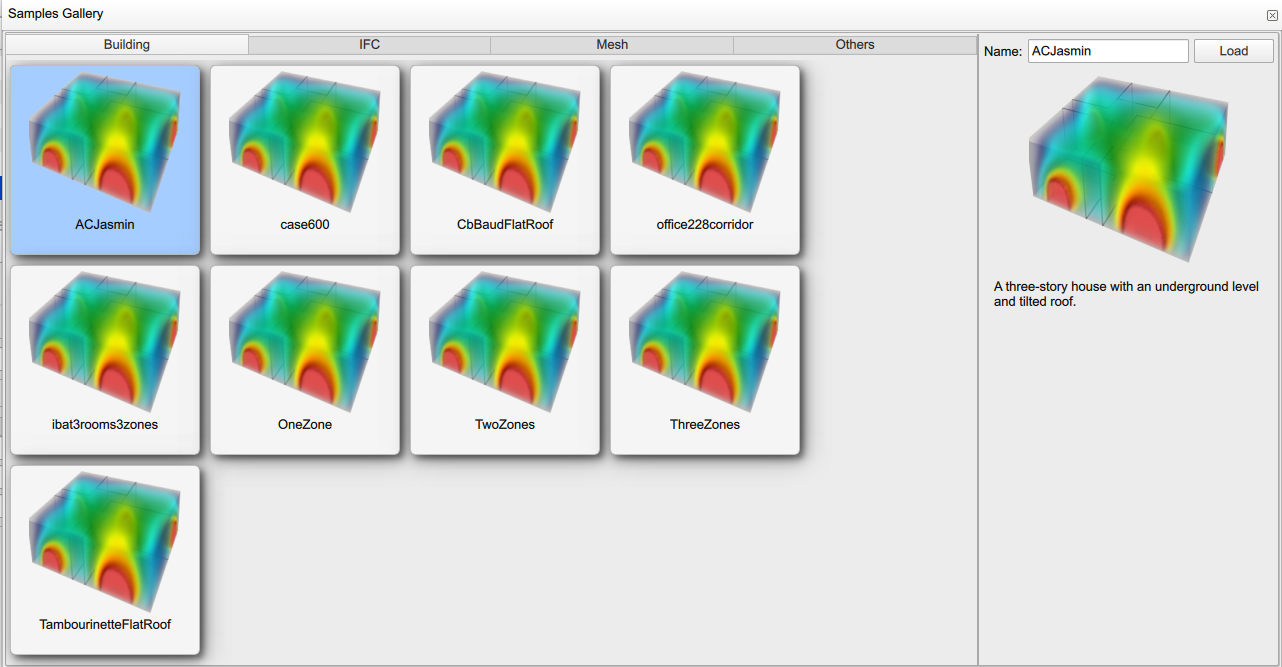
To use the building samples, click on ![]() and choose "Load samples". A "Samples Gallery" window is displayed with several buildings.
A top bar with different building functionalities enables you to choose the building test case of your interest, regarding the number of zones, the availability of IFC files or the use of a detailed mesh file.
You can choose the building test case at your convenience, then click Load.
and choose "Load samples". A "Samples Gallery" window is displayed with several buildings.
A top bar with different building functionalities enables you to choose the building test case of your interest, regarding the number of zones, the availability of IFC files or the use of a detailed mesh file.
You can choose the building test case at your convenience, then click Load.
A 3D view is displayed with the building, a "Project browser" panel and "Properties" panel.
You can zoom in or zoom out to see more details. You can rotate the building to see all its sides. You can pan the building to center it in your 3D view.
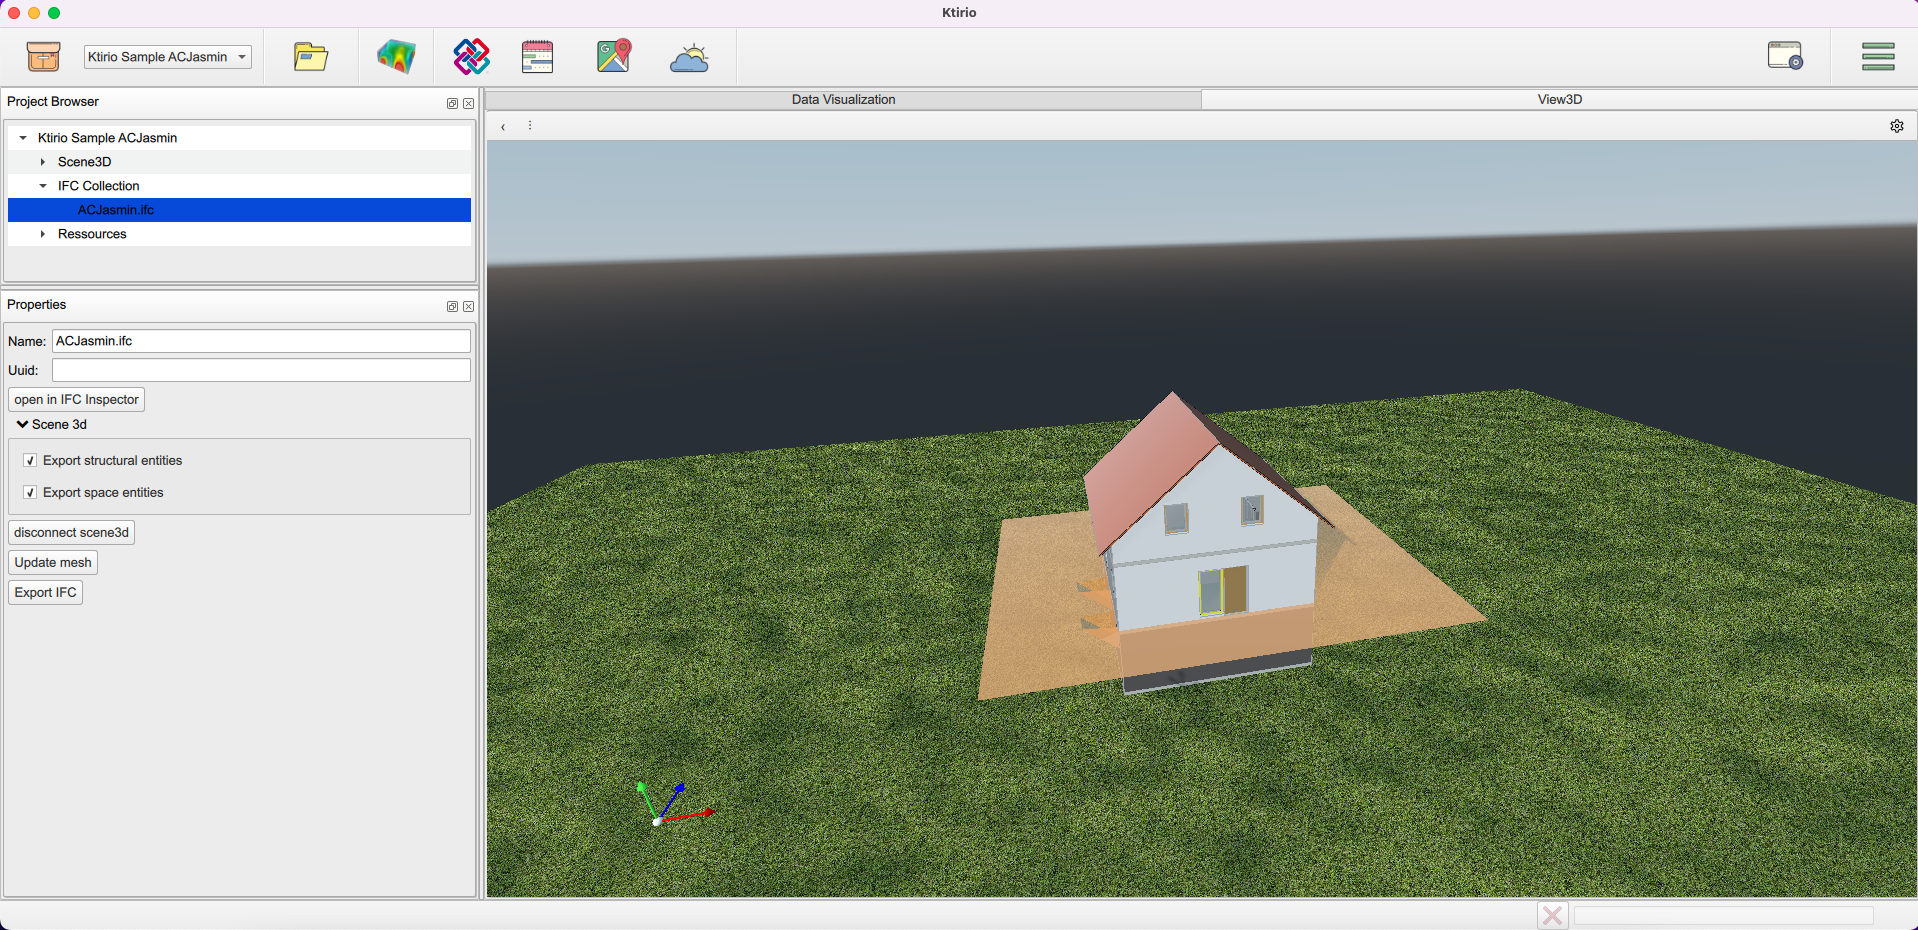
3. Basics of building visualization
In the "Project Browser" panel, you can see 3 components in the hierarchy:
-
"Scene 3D": enables you to handle environment and building properties such as background type and color, sun position, building orientation, light and shadow colors, and the different building’s components (doors, windows, walls,…) visual properties.
-
"IFC collection": which helps you to open the "IFC Inspector" button, or export the IFC file using "Export IFC" button. You can generate a mesh of the building using "Update mesh" button in the "Properties" panel then export it in the format of your convenience (STL or MSH).
-
"Resources": enables accessing the fmu model.
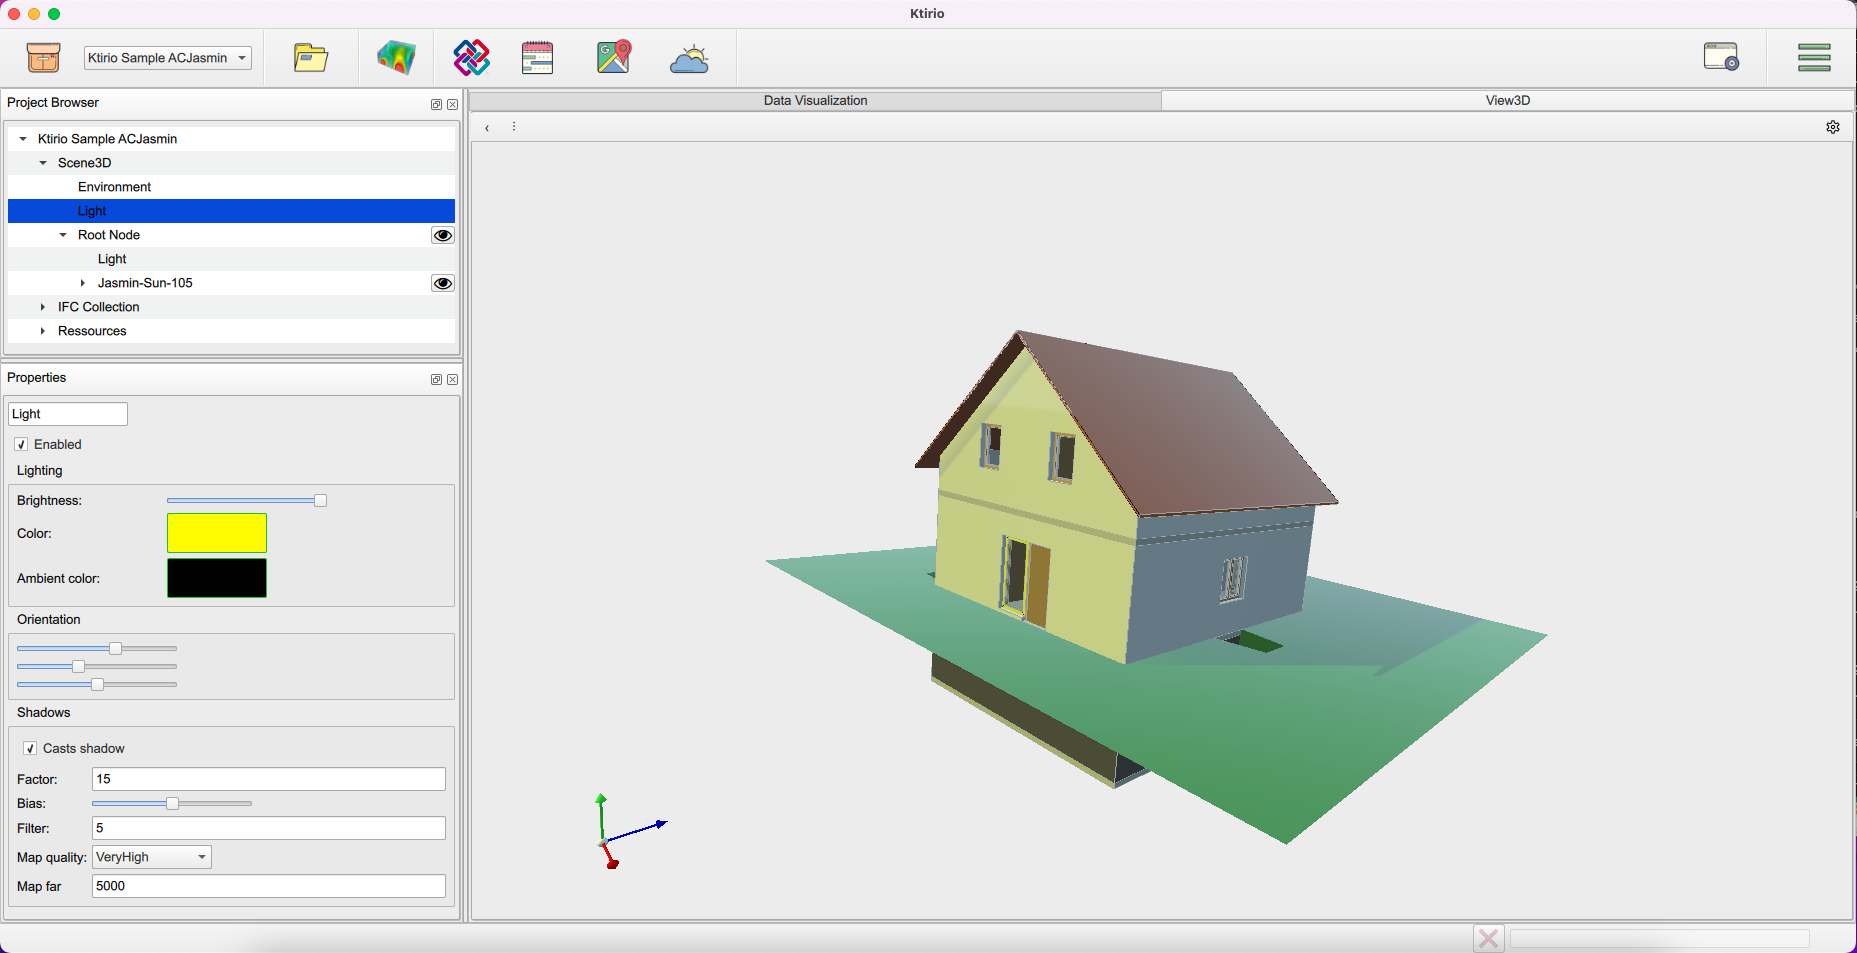
Here is a different view of the building in last figure, displayed with different environment and light configurations.
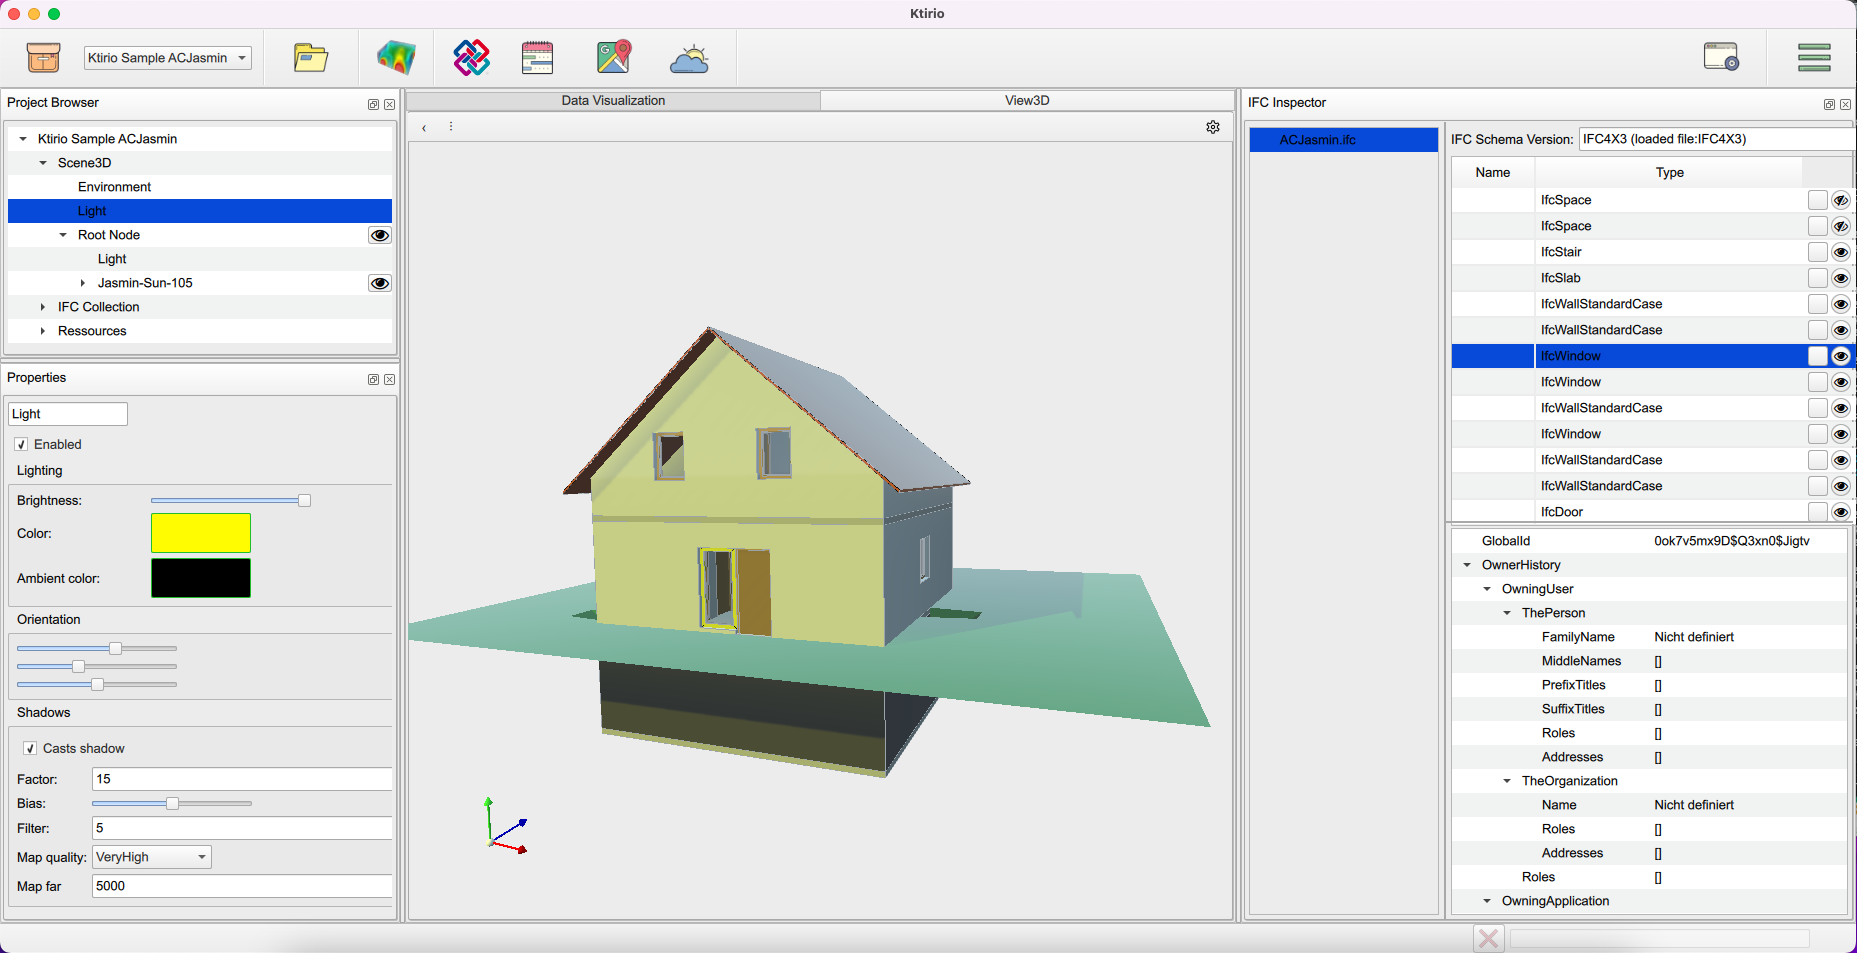
You can open the IFC inspector using the button "Open in IFC Inspector" in the "Properties" panel or inspector widget  in the toolbar. The IFC Inspector allows to open an inspector window that visualizes the building components (walls, roof, grounds, windows, doors) features and related information available in the IFC, such as width, heigh, materials, … it enables as well to visualize or hide components (walls, ground, windows, roof) from the 3D scene.
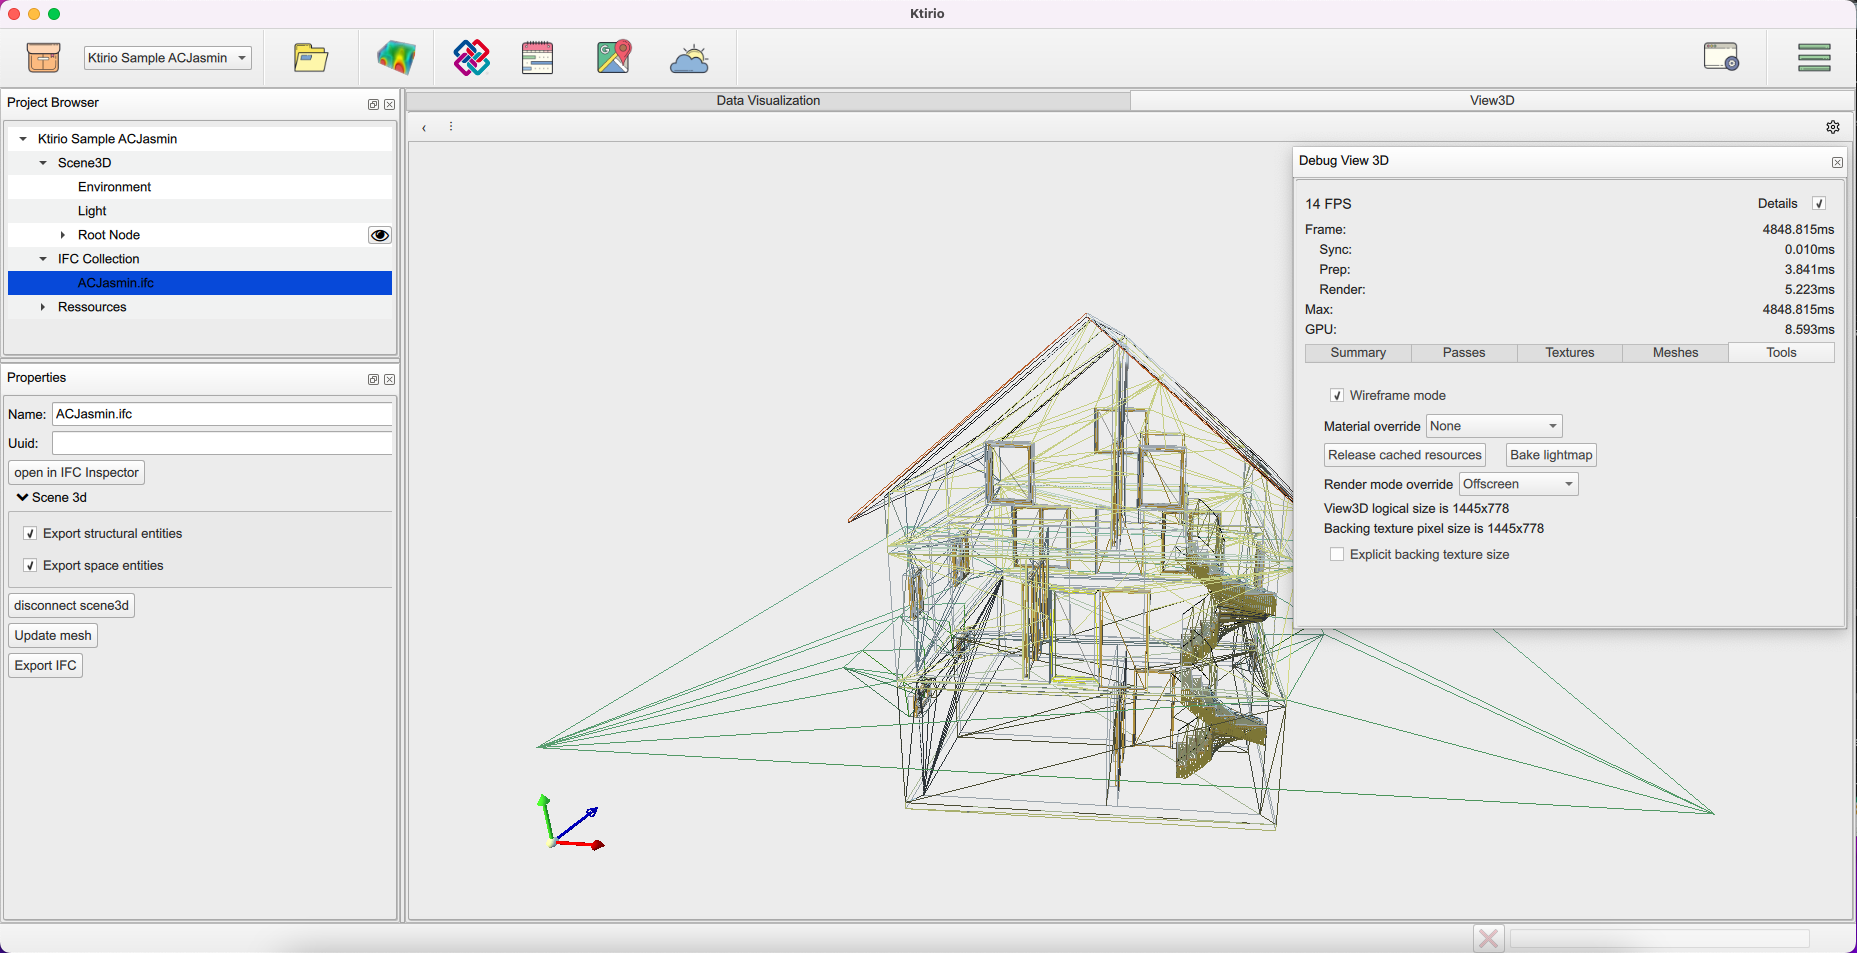
You can visualize the building wireframe using the "Debug view 3D" button  in the top right of your 3D scene. To do so, check the "Details" case in the debugging window. You can see building’s details of different types: "Summary", "Passes", "Texture", "Meshes" and "Tools". In the "Tools" panel, you can enable "Wireframe mode" to show the building’s wireframe 3D view.
4. Loading building IFC or STL file
You can use a building IFC or STL file of your interest.
To do so, click the "Import file" widget  . In the import window, you can fill in the "Location" of your file, if it’s saved on your devise, you can choose "Local". Otherwise, you can choose the name of your remote machine. I’s important to enter the file type "IFC" or "STL", then the file path to open in the corresponding fields. Then click Apply, then Import.
5. Getting weather data
Weather data are useful for building energy simulation. It directly impacts the indoor comfort, so the heating/cooling dynamics. The Ktirio-Gui interface allows to retrieve several weather features from OpenMeteo API for the location and area of interest.
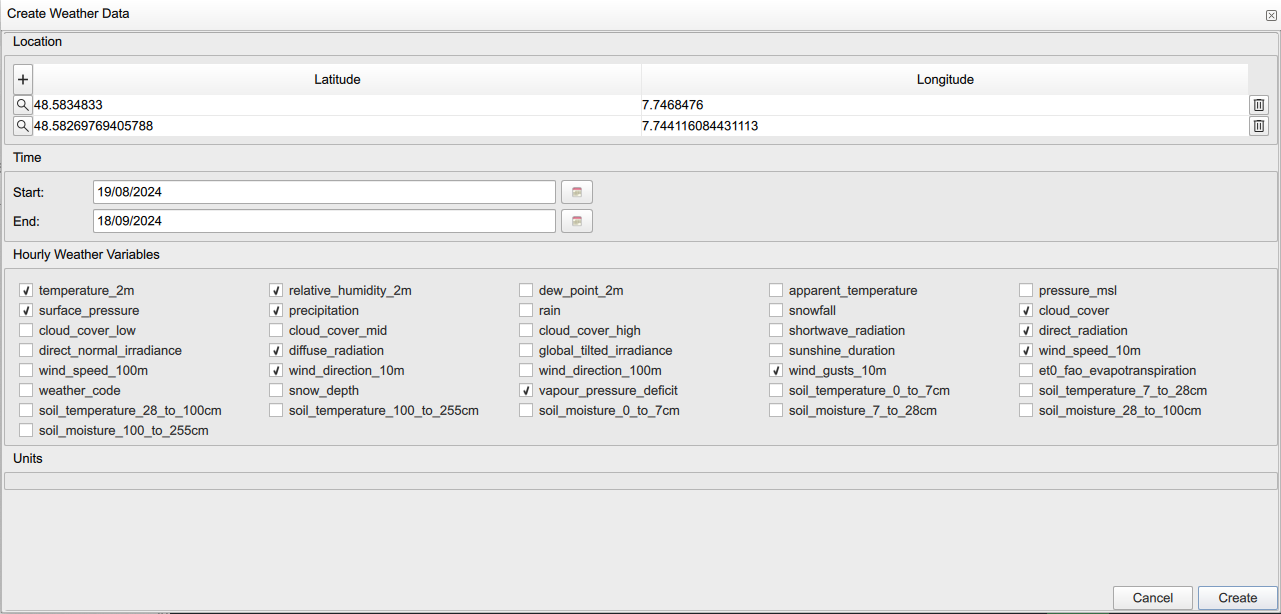
To use the Ktirio-Gui weather data, you can use the weather widget  in the toolbar. A "Create weather data" panel is displayed with fields for location (latitude, longitude), time (start and end) and several weather variables. You can add
  a location, modify
  a location using the geographic map, or delete
  a location. You can recover data within several locations.
Time fields refer to the time period for which you want to retrieve weather data. "Start" is the beginning date of the period and "End" is the concluding date of the period. "Hourly weather variables" fields allows to check weather features of your interest. It includes 36 variables including atmospheric ones such as temperature, humidity, pressure, cloud cover, wind and precipitation, irradiance ones such as direct irradiance, diffuse irradiance and global irradiance, and soil features such as soil moisture and soil temperature.
When you set location, time and data type of you interest, you can click "Create". It creates a new hierarchy in the "Project Browser" panel named "Weather data collection". When selecting the latter field, you can handle your data using tools in "Properties" panel. It enables you to "View" your data in the tabular format, where each line is timestamped using an additional "Time" column that indicates the time of the observed values.
Panel Properties allows as well, to Export your data in the comma separate file (csv) format.
