 .pdf
.pdf
Luxembourg
1. Introduction
In this document, we present an interactive Jupyter-powered report for Luxembourg, generated by the Ktirio Urban Building (KUB) toolkit. You’ll find:
-
A detailed walk-through of geographic and simulation parameters
-
Comparisons of input weather data against 30-year climatology
-
Building-level statistics (density, typology, heights, areas)
-
District-scale energy and comfort analyses (temperature profiles, shading, PMV/PPD)
All plots are rendered inline via Plotly, and you can hide or reveal code snippets as needed.
2. Reproduce the Results
You can rerun the full data-preparation and simulation pipeline for Luxembourg with these commands:
# 1. Pull the latest KUB container
apptainer pull -F kub.sif oras://ghcr.io/feelpp/ktirio-urban-building:master-sif

# 2. Download the CKAN bundle for Luxembourg
wget -O luxembourg.zip https://ckan.hidalgo2.eu/dataset/b4f091eb-93c9-42b7-a5e2-9279341935b4/resource/21b1a803-019e-4b42-80f6-59a769a3b363/download/luxembourg.zip
unzip luxembourg.zip

# 3. Create output folder
mkdir -p kub_outputs/luxembourg

# 4. Run the simulation
export APPTAINER_HOME=$PWD/kub_outputs/luxembourg
mpiexec -n 128 --bind-to core \
  apptainer exec \
    -B ./luxembourg/:/luxembourg/ \
    --env OMP_NUM_THREADS=1 \
    kub.sif feelpp_kub_cem \
      --config-files /luxembourg/luxembourg.cfg \
                     /luxembourg/IdealHeaters.cfg
After completion, open Paraview with the file
$APPTAINER_HOME/feelppdb/luxembourg/instances/np_128/lod0/exports/City_Energy_Modeling.caseClick here for more information on the model used for this computation
Multi zone model
The model used for the computation is a multizone model. For each time step and for each zone the algorithm compute the heatflow throught the different elements of the building. The energy balance adds up the thermal exchanges between the different zone and the exterior. Each building as x zone, x being the number of floors attributed to the building.
Click here for more information on the data used for this computation
Weather data
The data is drawn from open meteo. It collects forecast and historical data from national weather services. The weather station used for the given simulation is found through GIS informations and is given here :
Refer to : Station location
Building geometry
The building simulated are divided in three Level Of Detail (LOD) :
-
LOD-0 (Level of Detail 0):
-
Description: The most basic level of detail in modeling, representing buildings and urban elements with minimal complexity.
-
Characteristics: Simplified geometries, represented as block shapes without detailed architectural features. Typically used for large-scale city-wide simulations where high detail is not necessary. The block shape is computed as the minimum volume shape enclosing the building described by LOD-1.
-
-
LOD-1 (Level of Detail 1):
-
Description: An intermediate level of detail that includes more geometric and architectural features than LOD-0 provided by OpenStreetMap (OSM).
-
Characteristics: Basic building shapes with some architectural elements such as roofs and external walls. Suitable for simulations that require a moderate level of detail.
-
-
LOD-2 (Level of Detail 2):
-
Description: A higher level of detail that provides a more accurate and detailed representation of buildings and urban environments.
-
Characteristics: Detailed geometries including individual building components such as windows, doors, and structural elements.
-
All level details are used for simulations of energy consumption, thermal comfort, and environmental impact assessments. Increasing the LOD allows to improve accuracy. Currently only LOD-0 are used in city scale simulation, and LOD-0 and LOD-2 are used for single building simulation. LOD-1 is currently only supported for visualisation and solar masks computations
Building material and constructive systems
The building material and constructive systems can’t be drawn from OSM. As such, the R value is attributed to buildings surface according to a normal distribution.
Insulated
| Surface type | R mean value |
|---|---|
Wall |
3,9 |
Bottom slab |
2,2 |
Slab |
0,24 |
Roof |
0,23 |
The number of floors for each building is set using an euclidian division using building height and story height (set at 3 meter).
Building HVAC system
-
The heating system is fixed as an ideal heating source.
-
Air change rate is set to 0 as of now.
-
The cooling system is fixed as an ideal cooling source.
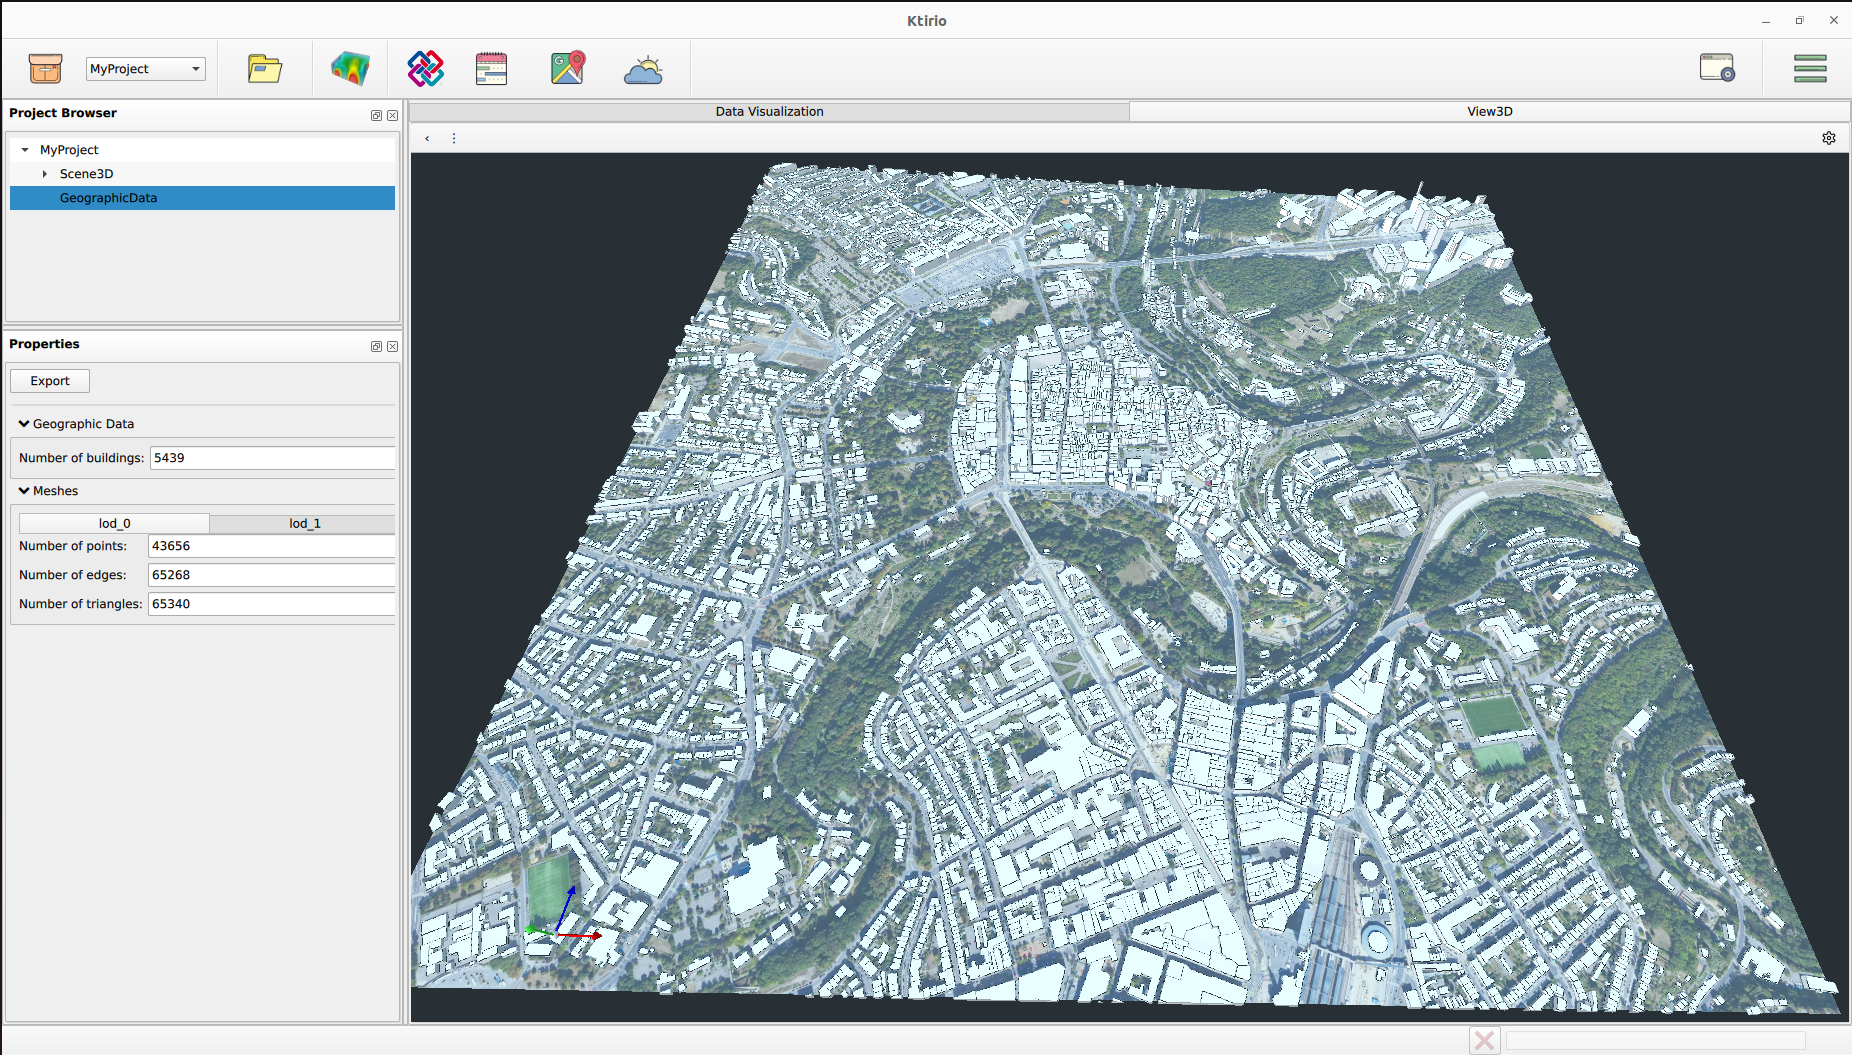
3. Luxembourg Report
3.1. General Information
3.2. Weather
We compare the simulation’s input weather data against 30-year climatological norms. You’ll see temperature trends, wind roses, solar radiation profiles, and cloud cover statistics—each offering insight into the boundary conditions driving building loads.
3.2.1. Climate
The figure below allows the comparison of the current simulation weather data within the climatological weather over the past 30 years. In the latter plot, the solid lines represent the monthly average temperature variations based on the current simulation’s weather data. The dotted lines show the monthly climate temperatures (are the monthly averaged mean, minimum and maximum temperatures using weather data from the past 30 years (1991-2020)). The coloured bars present the monthly temperature distribution within the annual extreme (minimum and maximum) temperatures. An annotation is presented with temperature deviations regarding the climatological averages.
3.2.2. Temperature, relative himidity and pressure
The following figure displays the monthly averaged wind speed and direction for the curent simulation’s period of time.
3.3. Buildings statistics
Here we dive into the urban fabric: number of buildings, spatial density, typology breakdowns, and the distributions of heights and floor areas. These metrics characterize the built environment you’ve modeled.
3.3.2. Building density
The heatmap below illustrates the density of the buildings used in the simulation model. Each point on the map corresponds to a building that has been simulated, providing a visual representation of building concentration within the specified area.
3.4. City scale energy consumption
This section presents the aggregate thermal performance of the district. You’ll find plots of ambient vs. interior/exterior temperatures, solar shading occlusion factors, heat fluxes for heating and cooling, and total energy demand — all key for evaluating system sizing and network design.
3.4.1. Temperature variations
The following figure shows the simulation’s mean temperature outputs. Where:
- Ambient temperature
-
is city ambient air temperature.
- Exterior temperature
-
is the average temperature of the exterior surfaces of all buildings.
- Interior temperature
-
is the average indoor temperature of all buildings.
The temperatures are plotted as functions of time.
3.4.2. Solar Shading
Click here for more information on the computation of the occlusion factor
Occlusion Factor
The multizone model includes a number of nodes for each building to calculate solar gain, an occlusion factor is attributed to each node. This occlusion factor is a discrete value of either 1 or 0, where 1 indicates occluded and 0 indicates not occluded. The simulation uses ray tracing to compute the occlusion factor. If a node is occluded, there is no solar gain to be considered; if a node is not occluded, the solar gain is added to the thermal balance equation. This process is iterated for each timestep.
| Currently, the occlusion factor is expected to be quite high (around 0.7) since the mean calculation does not discriminate between different surface types (wall, slab, and roof) or consider orientation. In the near future, only surfaces with potential solar gain will be taken into account. |
The figure below gives an overview of the occlusion factor across the city. The scale goes from 1 (occluded) to 0 (not occluded), the plain line is the mean occlusion during the year, the dotted lines are the min and max occlusion during the year.
3.4.3. Heating and cooling power
- Heating capacity
-
is the heating power needed to maintain a set point temperature in buildings for an outdoor temperature equal to the minimal temperature that occured during the previous 30 years without solar or internal gains.
- Max heating power
-
is the maximal heating power output that occured during the simulation.
Heating capicity |
(kW) |
Max heating power |
(kW) |
The figure below illustrates the average power output of an ideal heating source and an ideal cooling source across the city. The set point temperature is 20°C for heating and 24°C for cooling. Currently, the calculations do not account for specific heating or cooling seasons.
3.5. City scale comfort indicators
Finally, we assess occupant comfort at the district level using PMV and PPD metrics. Time-series and scatter plots illustrate how thermal comfort varies through the year and relates to predicted dissatisfaction.
3.5.1. PMV and PPD
Click here for more information about PMV
Predicted Mean Vote (PMV)
The Predicted Mean Vote (PMV) is a widely used index in the field of thermal comfort research. It predicts the mean thermal sensation vote of a large group of people on the seven-point thermal sensation scale. The PMV index is based on the heat balance of the human body, considering various factors that influence thermal comfort. The indicator is best used for fully mechanically ventilated building.
Key factors
-
Metabolic Rate (Met): The rate at which the human body produces heat, which varies depending on the activity level.
-
Clothing Insulation (Clo): The thermal insulation provided by clothing.
-
Air Temperature (Ta): The temperature of the air surrounding the person.
-
Mean Radiant Temperature (Tr): The average temperature of the surrounding surfaces.
-
Air Velocity (Va): The speed of the air moving around the person.
-
Relative Humidity (Rh): The amount of moisture in the air.
Value Ranges
The PMV scale ranges from -3 to +3, where:
-
+3 represents "Hot"
-
+2 represents "Warm"
-
+1 represents "Slightly warm"
-
0 represents "Neutral"
-
-1 represents "Slightly cool"
-
-2 represents "Cool"
-
-3 represents "Cold"
Practical Application
In practical terms, the PMV index is used by engineers and architects to design HVAC (Heating, Ventilation, and Air Conditioning) systems that provide a comfortable indoor environment. By maintaining conditions where the PMV is close to zero, the majority of occupants are expected to feel thermally neutral.
Standards and Guidelines
The PMV index is a critical component of several thermal comfort standards, including:
-
ISO 7730: Ergonomics of the thermal environment—Analytical determination and interpretation of thermal comfort using calculation of the PMV and PPD indices and local thermal comfort criteria.
-
ASHRAE Standard 55: Thermal Environmental Conditions for Human Occupancy.
These standards provide detailed methodologies for calculating PMV and PPD and offer guidelines for creating thermally comfortable environments.
Limitations
PMV tends to overestimate thermal discomfort, it yields predictiction that are biased with respect to operative temperature, humidity, air movement, clothing insulation, and metabolic rate. The range of its component variable that are consistent with the valid use of PMV are much narrower than those given in ISO 7730. Nethertheless PMV tends to be consistent to predict thermal comfort near neutral thermal conditions. Thus explaining the restriction of this indicator to mecanichally ventilated buildings where the discrepency in thermal environnements is narrower and closer to thermal neutrality compared to naturally ventilated buildings where thermal environnements tends to be less continous resulting in an overestimation of thermal discomfort due to the biases aforementionned.
-
Michael A Humphreys, J Fergus Nicol, The validity of ISO-PMV for predicting comfort votes in every-day thermal environments, Energy and Buildings, Volume 34, Issue 6, 2002, Pages 667-684, ISSN 0378-7788
The following figure displays the pmv as a function of time, the indicator is averaged across the city. Thermal comfort can be achieved in the range of \(PMV=[-0,5;0,5]\).
Click here for more information about PPD
Predicted Percentage of Dissatisfied (PPD)
The Predicted Percentage of Dissatisfied (PPD) is an index that predicts the percentage of people likely to feel thermally uncomfortable in a given environment. The PPD index is closely related to the Predicted Mean Vote (PMV) and provides a quantitative measure of the thermal comfort level of a large group of people.
The PPD index is derived from the PMV value and expresses the percentage of people who are dissatisfied with the thermal environment. The PPD index is based on extensive research and field studies and is included in international standards such as ISO 7730 and ASHRAE Standard 55.
Relationship between PMV and PPD
The relationship between PMV and PPD is non-linear and can be expressed through an empirical equation or a lookup table. Generally, as the PMV moves away from 0 (neutral) towards either +3 (hot) or -3 (cold), the PPD increases, indicating a higher percentage of people who are likely to be dissatisfied with the thermal conditions.
Key Points
-
Low PPD: A low PPD value (typically below 10%) indicates that the majority of people are satisfied with the thermal environment.
-
High PPD: A high PPD value indicates a higher percentage of people who feel uncomfortable, suggesting that the thermal conditions are less suitable for the majority.
Practical Application
In practice, engineers and architects use the PPD index alongside the PMV to design and evaluate HVAC (Heating, Ventilation, and Air Conditioning) systems and building environments. The goal is to maintain thermal conditions that minimize the PPD, thus maximizing occupant comfort.
By keeping the PMV close to zero, designers can achieve a low PPD, ensuring that most occupants feel thermally comfortable. Typically, a PPD of less than 10% is considered acceptable in many standards.
Standards and Guidelines
The PPD index is a critical component of several thermal comfort standards, including:
-
ISO 7730: Ergonomics of the thermal environment—Analytical determination and interpretation of thermal comfort using calculation of the PMV and PPD indices and local thermal comfort criteria.
-
ASHRAE Standard 55: Thermal Environmental Conditions for Human Occupancy.
These standards provide detailed methodologies for calculating PMV and PPD and offer guidelines for creating thermally comfortable environments.
The following figure plot the PPD as a function of time averaged across the city. The recommended value to achieve thermal comfort is around 10%.
The following figure displays the PPD as a function of PMV. The middle values are near thermal neutrality, any point plotted away from the center will suggest a thermal discomfort, cold to the left and hot to the right.